In today's fast-paced digital landscape, understanding the right performance testing metrics is crucial for any software quality assurance professional. This guide delves into the key indicators that truly matter when your applications hit production, ensuring optimal user experience and business continuity.
In the relentless pursuit of software excellence, the gap between development and production can often feel like a chasm. Applications that perform flawlessly in staging environments can buckle under the real-world pressures of user traffic, diverse network conditions, and complex data interactions. For software quality assurance professionals and QA management, identifying and tracking the right performance testing metrics in production is not just about avoiding catastrophic failures; it's about safeguarding user experience, protecting brand reputation, and directly impacting business success. with the increasing reliance on AI-driven systems and real-time data processing, the stakes for robust application performance have never been higher.
The digital economy demands instant gratification. Users expect seamless interactions, and even a few seconds of delay can lead to significant abandonment rates. According to a a recent study, a one-second delay in mobile page load time can decrease conversions by up to 20% and negatively impact customer satisfaction by 10%. This underscores why focusing on performance metrics that directly translate to user satisfaction and business outcomes is paramount. Simply running load tests isn't enough; understanding what to measure and how those measurements reflect real-world performance is the true art of modern performance engineering.
Beyond Basic Load: Why Production Metrics Demand a Deeper Dive
Traditional performance testing often focuses on synthetic benchmarks and peak load scenarios. While valuable, these tests don't always capture the nuances of a live production environment. Production metrics offer a dynamic, real-time view of how your application behaves under actual user conditions. This distinction is critical for identifying bottlenecks that might only emerge with specific user behavior patterns, data volumes, or third-party integrations.
Consider the shift towards microservices and serverless architectures. These distributed systems introduce new complexities in performance monitoring. A single transaction might traverse multiple services, databases, and external APIs. Pinpointing the exact source of a performance degradation requires a granular understanding of how each component is contributing to the overall user experience. This is where advanced monitoring tools and a focus on actionable production metrics become indispensable.
Key Performance Testing Metrics for Production Environments
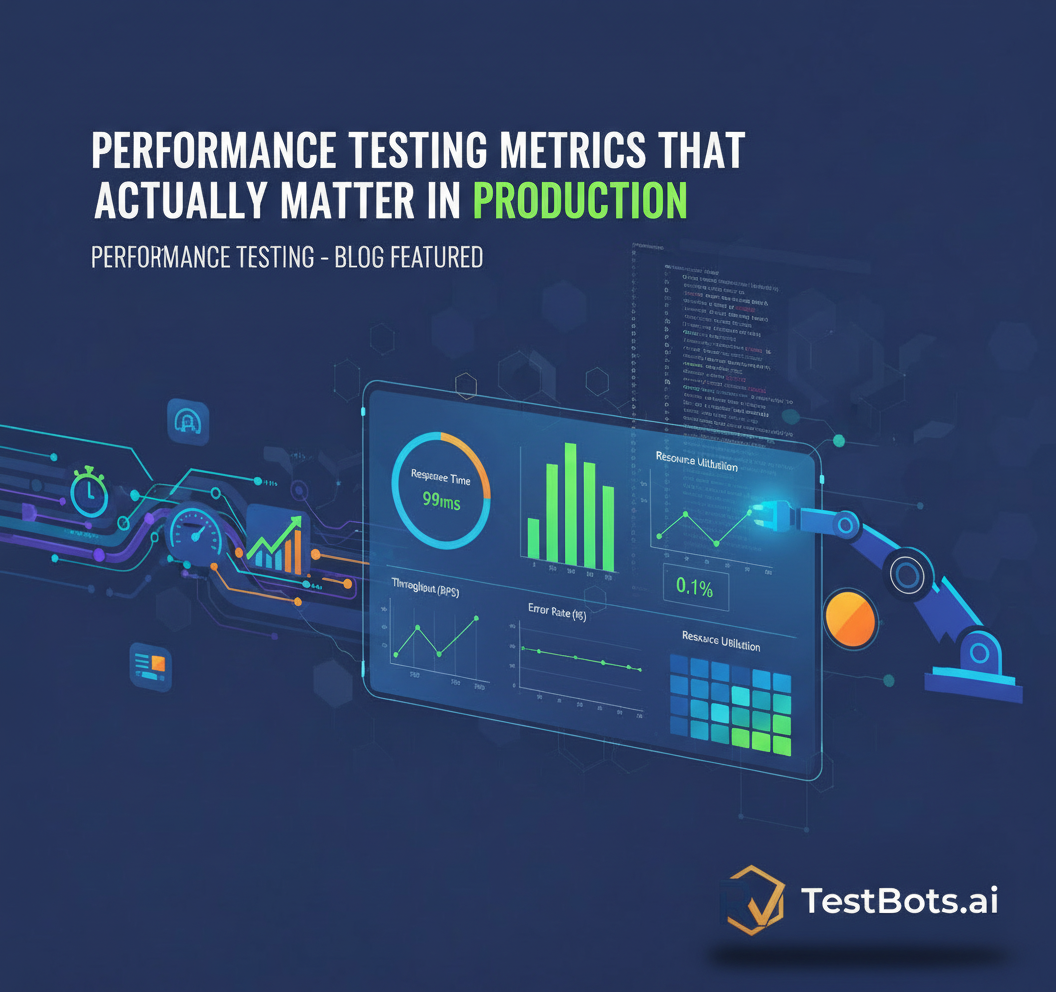
When evaluating performance in production, it's crucial to move beyond simple averages and delve into metrics that provide a holistic, user-centric view. Here are the metrics that truly matter:
1. Response Time (Latency) - The User's Direct Experience
- Definition: The total time taken for an application to respond to a user request. This includes network latency, server processing time, and front-end rendering time.
- Why it Matters: This is arguably the most critical metric from a user's perspective. High response times directly correlate with user frustration and abandonment. Monitoring this metric across different user journeys and geographical locations provides immediate insight into user satisfaction.
- Key Considerations: Don't just look at the average. Crucially, monitor percentiles (e.g., 90th, 95th, 99th percentile). While the average response time might look good, the 99th percentile could reveal that 1% of your users are experiencing unacceptably slow interactions, which could still represent thousands of frustrated customers.
- Actionable Insight: Spikes in specific percentiles often indicate intermittent issues, database bottlenecks, or slow third-party API calls.
2. Throughput - Handling the Load
- Definition: The number of transactions or requests processed by the application per unit of time (e.g., requests per second, transactions per minute).
- Why it Matters: Throughput measures the system's capacity to handle user load. A declining throughput under increasing load indicates a bottleneck that prevents the system from scaling effectively.
- Key Considerations: Correlate throughput with response time. Ideally, throughput should increase with load up to a certain point, after which response times will begin to degrade. The point where response times become unacceptable while throughput is still rising indicates optimal capacity.
- Actionable Insight: If throughput suddenly drops while the number of active users remains high, it's a strong indicator of a system failure or severe bottleneck.
3. Error Rate - Stability and Reliability
- Definition: The percentage of requests that result in an error (e.g., HTTP 5xx errors, application-specific errors).
- Why it Matters: Even if your application is fast, a high error rate means users aren't completing their tasks. This directly impacts conversions, data integrity, and user trust.
- Key Considerations: Monitor different types of errors (server-side, client-side, specific API errors). A sudden spike in a particular error type can quickly point to a recently deployed change or an overloaded service.
- Actionable Insight: Set strict thresholds for error rates. Even a 0.1% error rate can be significant in high-traffic applications. Proactive alerts are essential here.
4. Resource Utilization - System Health and Scalability
- Definition: Metrics related to the consumption of system resources, including CPU utilization, memory usage, disk I/O, and network I/O.
- Why it Matters: High resource utilization often precedes performance degradation. Monitoring these helps identify bottlenecks in your infrastructure before they impact users. It also informs scaling decisions.
- Key Considerations: Monitor these metrics at the server, container, and even process level. Look for specific processes or services consuming excessive resources.
- Actionable Insight: A consistently high CPU or memory usage can indicate inefficient code, memory leaks, or insufficient infrastructure. Proactive capacity planning based on these metrics is crucial especially with elastic cloud environments.
5. Application Performance Index (APDEX) - User Satisfaction Score
- Definition: APDEX (Application Performance Index) is an open standard for measuring application performance, treating performance as a user's satisfaction with the response time of business applications. It converts multiple measurements into a single number on a scale of 0 to 1, where 1 is the best.
- Why it Matters: APDEX provides a unified, quantifiable measure of user satisfaction, making it easier to communicate performance health to non-technical stakeholders. It categorizes response times into 'Satisfied,' 'Tolerating,' and 'Frustrated' thresholds.
- Key Considerations: Define your 'Satisfied' and 'Tolerating' thresholds based on business requirements and user expectations for different transactions.
- Actionable Insight: A declining APDEX score is a clear signal that user experience is degrading, prompting immediate investigation.
6. Database Performance Metrics - The Unseen Bottleneck
- Definition: Metrics such as query execution time, number of slow queries, database connection pool utilization, and lock contention.
- Why it Matters: Databases are frequently the bottleneck in complex applications. Slow queries, inefficient indexing, or connection issues can severely degrade overall application performance.
- Key Considerations: Monitor metrics for each database instance and identify the most time-consuming queries. Use tools to analyze query plans and suggest optimizations.
- Actionable Insight: A sudden increase in slow queries or lock contention can indicate issues with recent code deployments, data growth, or a lack of proper indexing.
Implementing Effective Production Performance Monitoring
Collecting these metrics is only half the battle. The real value comes from effective monitoring, analysis, and remediation. Here's how to build a robust performance monitoring strategy:
1. Choose the Right Tools for Your Stack
- Invest in Application Performance Monitoring (APM) solutions that provide end-to-end visibility, distributed tracing, and real-user monitoring (RUM). Solutions like Dynatrace, New Relic, and Datadog are leading the market .
- Ensure your tools integrate with your cloud providers (AWS, Azure, GCP) and support your specific technology stack (Java, Python, Node.js, etc.).
2. Establish Baselines and Set Meaningful Alerts
- Once your application is in production, monitor it for a period to establish normal operating baselines for all key metrics.
- Set up proactive alerts for deviations from these baselines. Don't just alert on absolute thresholds; use dynamic baselining features offered by modern APM tools to detect anomalies.
- Prioritize alerts based on their impact on user experience and business criticality.
3. Integrate Performance Monitoring into Your DevOps Pipeline
- Performance testing shouldn't be a post-deployment activity. Integrate it into your CI/CD pipeline. Azure DevOps Integration, for example, can streamline this process.
- Automate performance tests at every stage, from unit to integration to end-to-end. Tools like TestBots.ai's AI Test Studio can help you create and manage these tests efficiently.
- Conduct regular production-like load testing and stress testing in pre-production environments using realistic data volumes and user profiles.
4. Foster a Culture of Performance Engineering
- Performance is everyone's responsibility, not just the QA team's. Educate developers on the importance of performance considerations from the design phase.
- Regularly review performance metrics with development, operations, and business stakeholders. Use findings to drive continuous improvement.
- Embrace chaos engineering principles to proactively identify weak points in your system's performance and resilience.
The ability to identify, track, and act upon the right performance testing metrics is a hallmark of mature software quality engineering. As applications become more complex and user expectations continue to rise, a proactive and data-driven approach to performance monitoring in production is no longer a luxury but a necessity. By focusing on metrics that truly reflect user experience and system health, organizations can ensure their software not only functions but excels under the pressures of the real world.
"Performance is not just a feature; it's a fundamental aspect of user experience and business success. Ignoring production performance metrics is akin to driving blind." - Ministry of Testing
At TestBots.ai, we understand the critical role these metrics play. Our platform is designed to empower QA professionals and engineers with tools to not only perform robust testing but also to gain insights into real-world application performance. From our Test Script Recorder for effortless test creation to comprehensive monitoring capabilities, we provide the intelligence you need to ensure your applications perform flawlessly, every single time. Explore our free tools to enhance your testing arsenal and elevate your performance engineering strategy today.

Sarah Mitchell
Performance testing expert specializing in large-scale distributed systems. Former lead at a Fortune 500 tech company.